
Mine Subsidence Insurance Homepage
Pennsylvania Historic Underground Mine Map Database
If you need further assistance regarding mine mapping shown on this site, please contact the Technical Services Unit of the Pennsylvania Department of Environmental Protection’s - California District Office at 724 769 1100 or email your question(s) to ep-csr@pa.gov.
1. How do I interpret features on detailed mine maps?
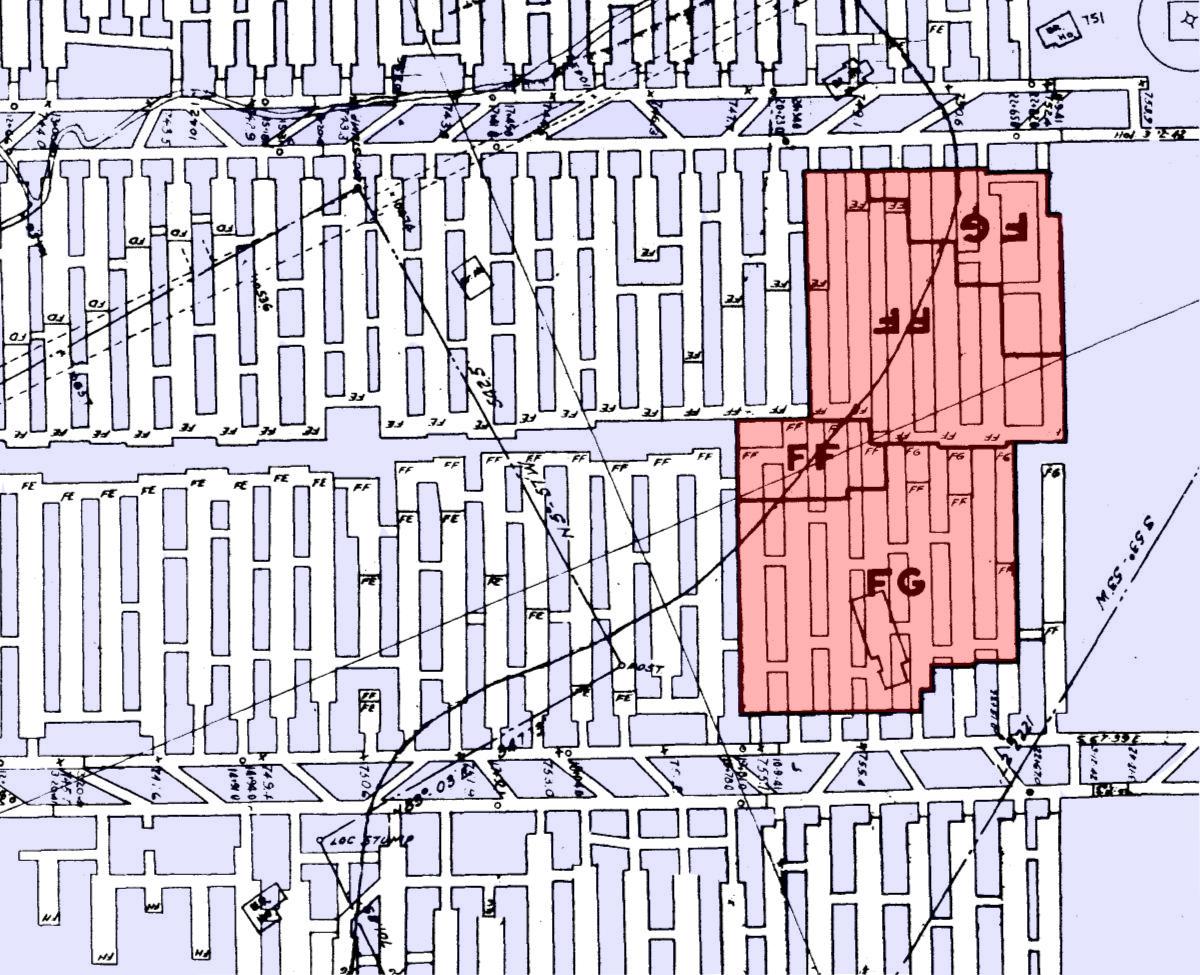
Figure 1
Figure 1 shows room and pillar and retreat mining methods.
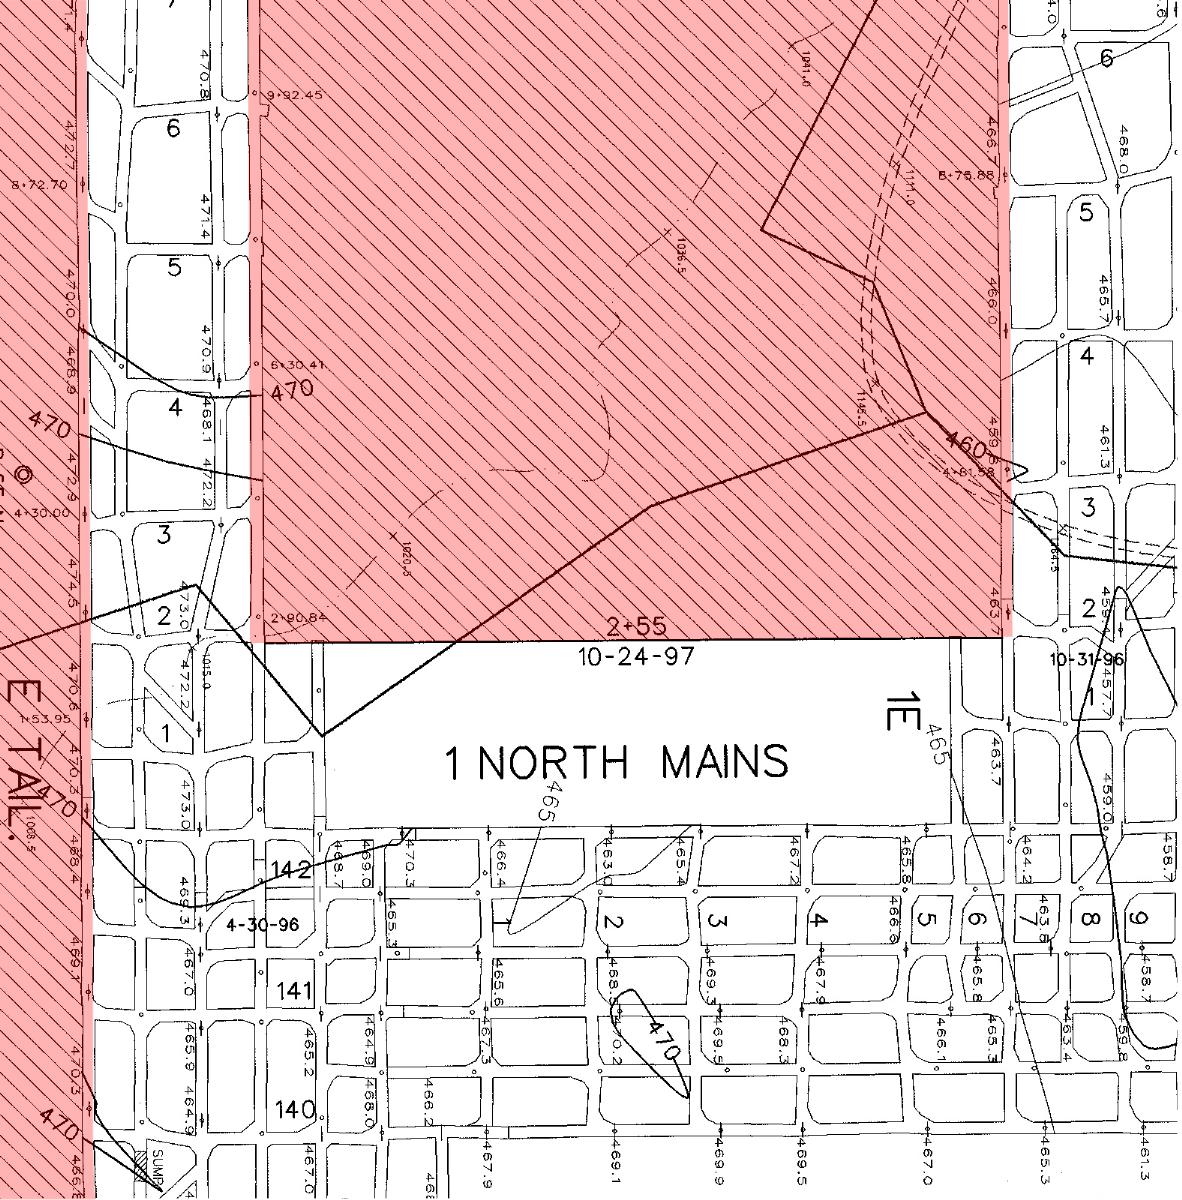
Figure 2
Figure 2 shows longwall and room and pillar mining methods
Figure 3
Figure 3 shows a section of a detailed mine map highlighting important text features located on detailed mine maps.
"A"is an area that has been retreat mined. The hatching on
the line shows the limit of the retreat mining and is generally
on the side of the line that was retreat mined. This is just one of
many ways a company illustrates an area as mined out.
"B" When a company retreat mines an area they often place a
letter code on the map indicating the date the retreat mining took
place in that area.
"C" is a survey point or spad location within the mine
workings. You will generally not be concerned with this number but will
see it on most mine maps.
"D" Is an actual survey date indicating when the operator drove the mine entry (tunnel) to that point.
"E" Is the elevation of the coal seam. This number is
usually easily recognized as most operators survey to the tenth of a
foot. Mine elevations are given in "Feet Above Mean Sea Level".
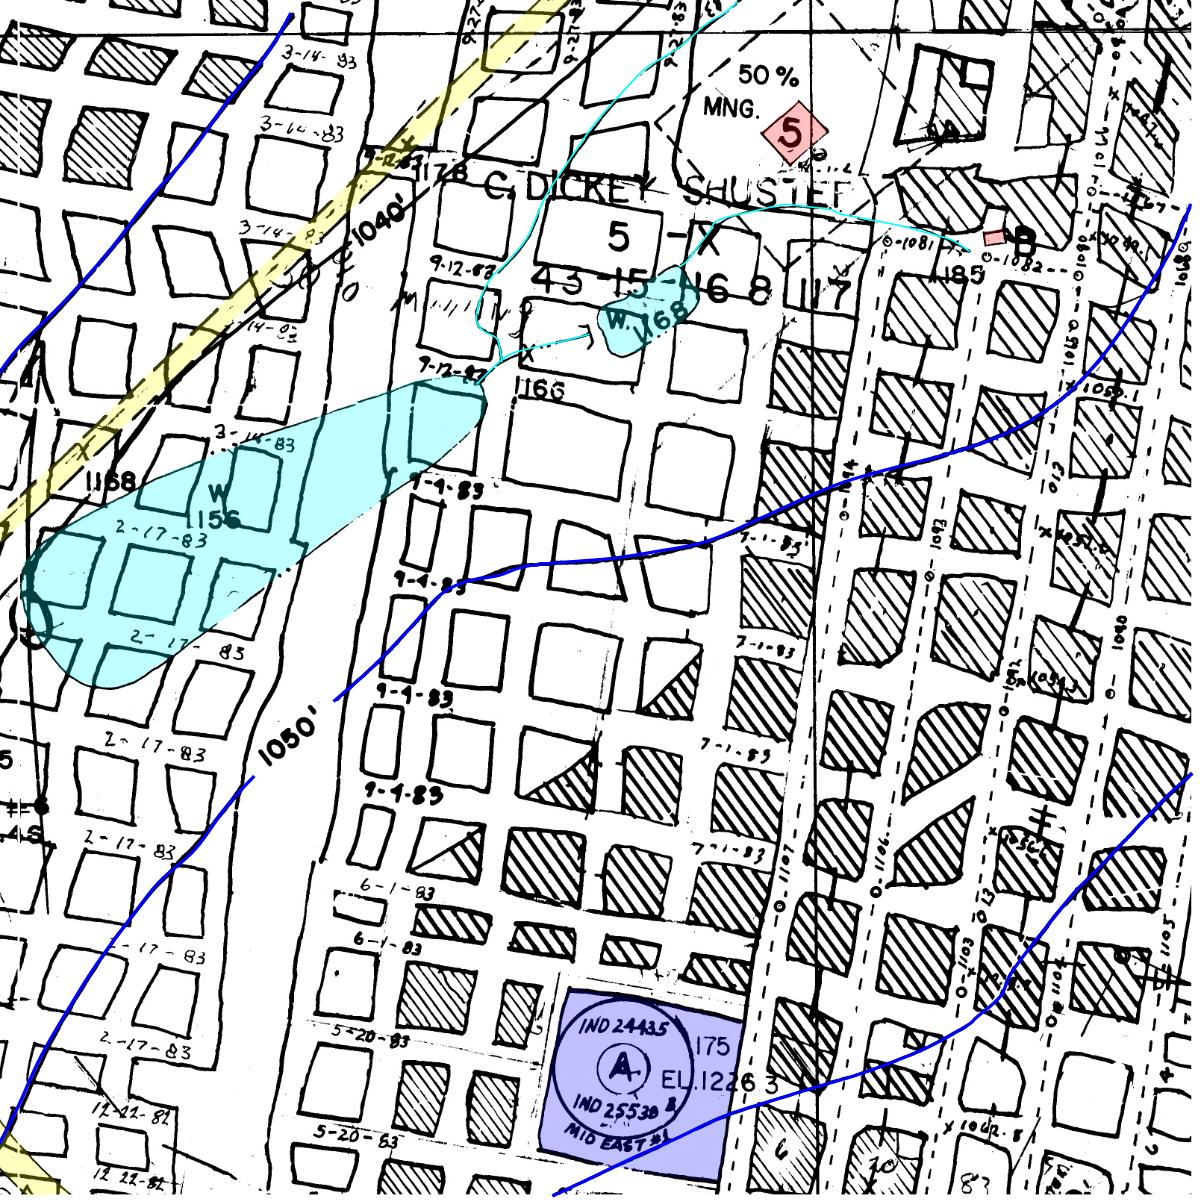
Figure 4
Figure 4 shows a section of a detailed mine map with surface features highlighted.
WPA Mapping was drawn in the 1930’s as part of the “Works Progress Administration”. All mining shown on the WPA Maps is assumed to have taken place ‘Prior to 1935’. The WPA Maps were laid out based on the 15’ USGS Topographic Quadrangles consisting of nine (9) sections, each covering one 15’ Quadrangle.
3. How do I interpret mine workings on WPA mine maps?
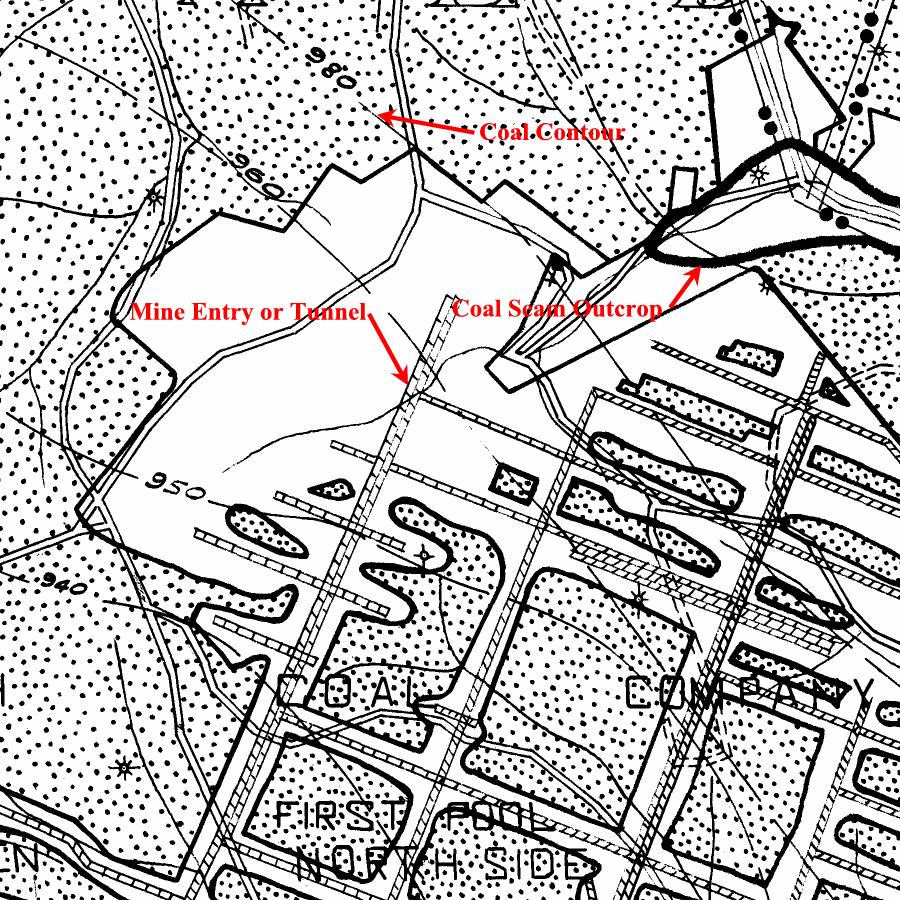
Figure 5
Figure 5. is a section of the WPA-Pittsburgh Sheet No 4. When looking at a WPA Map any areas that are speckled are assumed to be mined out completely. Clear areas, which are inside the outcrop, were not mined as of 1935 and need to be researched further. The symbol that looks like a ladder indicates where room and pillar mining occurred. The WPA mine map indicates the elevation of the coal seam with coal structure contours. The elevations are in feet “above sea level”. The coal seam outcrop is shown using a heavy black line. The outcrop is the point where the coal seam elevation and the surface elevation are equal. When determining the location of the outcrop, use the elevation of the coal seam from the WPA Map as it relates to the surface elevation on the USGS 7 ½’ topographic quadrangle and not the outcrop location as shown on the WPA Map.
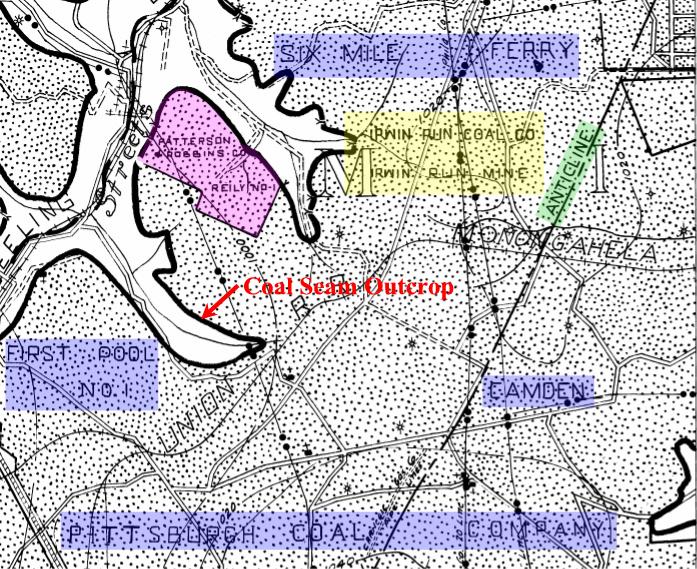
Figure 6
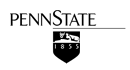
Figure 6 shows how mine names and operators are listed on WPA mine maps. The area a mine occupies may be well defined as with the Reily No 1 Mine operated by the Patterson and Robbins Co (highlighted in pink). Other mines are not well defined as to their extent, like the Irwin Run Mine operated by the Irwin Run Coal Co (highlighted in yellow). For larger operators that may have several mines in an area, individual mine boundaries are not generally defined as these mines were often interconnected, such as the Six Mile Ferry Mine, the Camden Mine, and the First Pool No 1 Mine, all operated by the Pittsburgh Coal Company (highlighted in blue). In situations where mine boundaries are not well defined it may be difficult to determine exactly the area a mine occupies.
4. How are WPA mine maps named?
The below chart illustrates how the 15’ USGS Topographic Quadrangles, 7 ½’ USGS Topographic Quadrangles and the WPA mine maps relate to each other. The WPA mine maps are always named for the 15’ USGS Topographic Quadrangle they are located on.
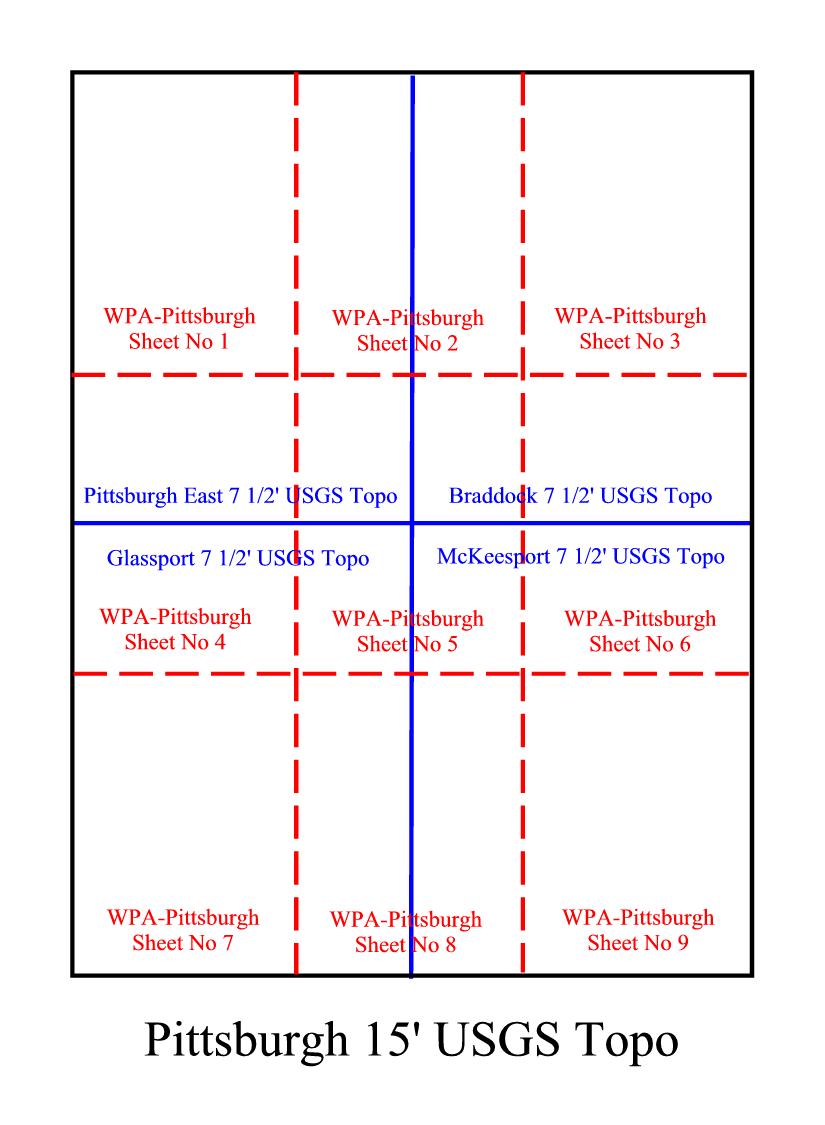
Figure 7
Figure 7 shows how WPA mine maps are named. Located in the lower right corner of each WPA mine map is the sheet name and coal seam covered by the sheet. In this example, the map is the "WPA Pittsburgh Sheet No 4" and the coal seam would be the "Pittsburgh Coal Seam"
5. What do the symbols on WPA mine maps mean?
Three legends generally appear at some point around the edge of the WPA Map. They do not always appear in the same location.
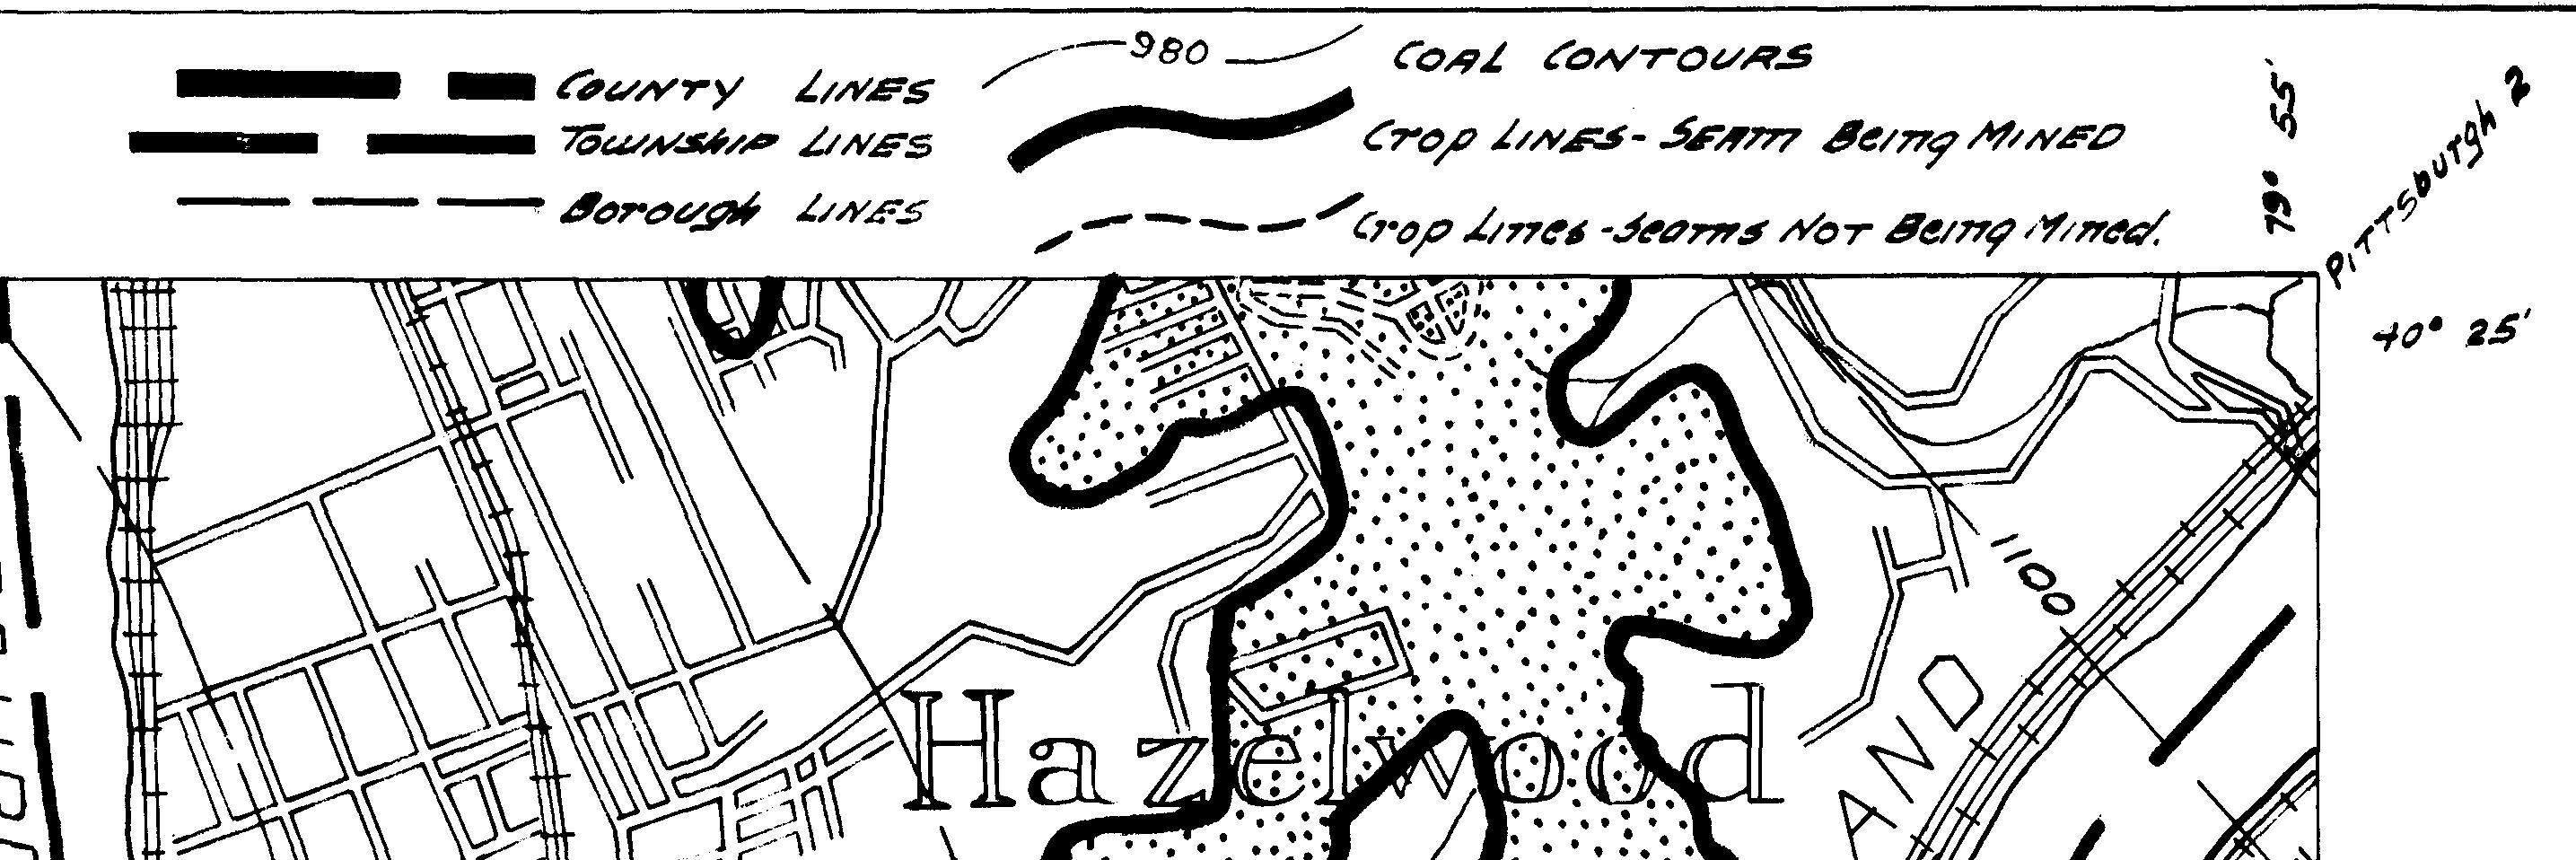
Figure 8. shows some of the lines you will see on the WPA Map.
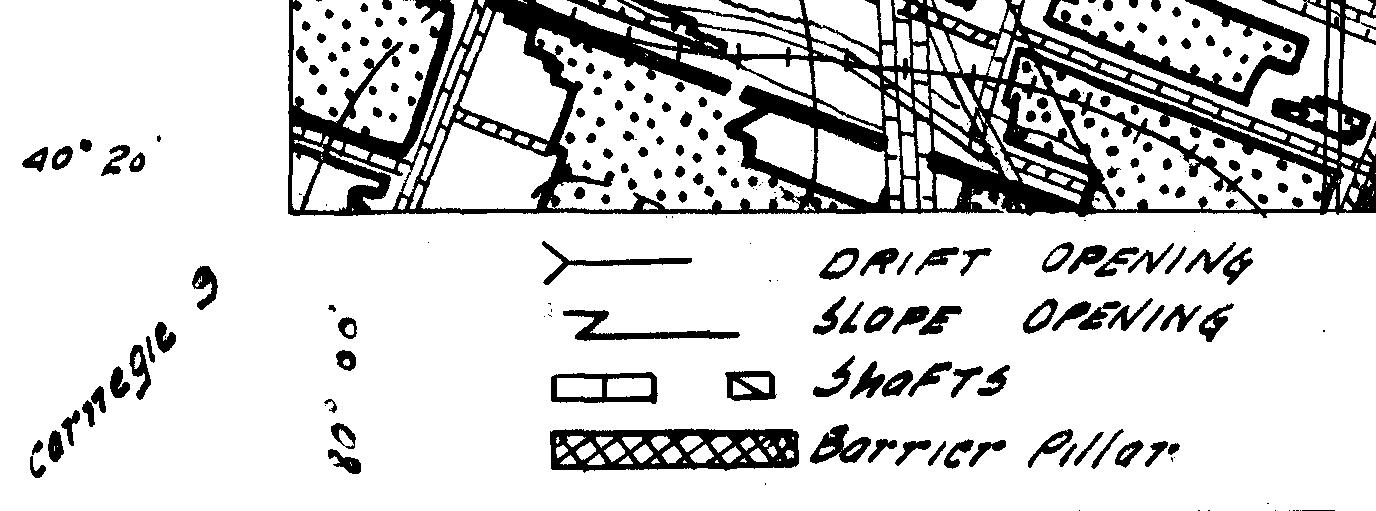
Figure 9. shows some of the symbols on the WPA Map.
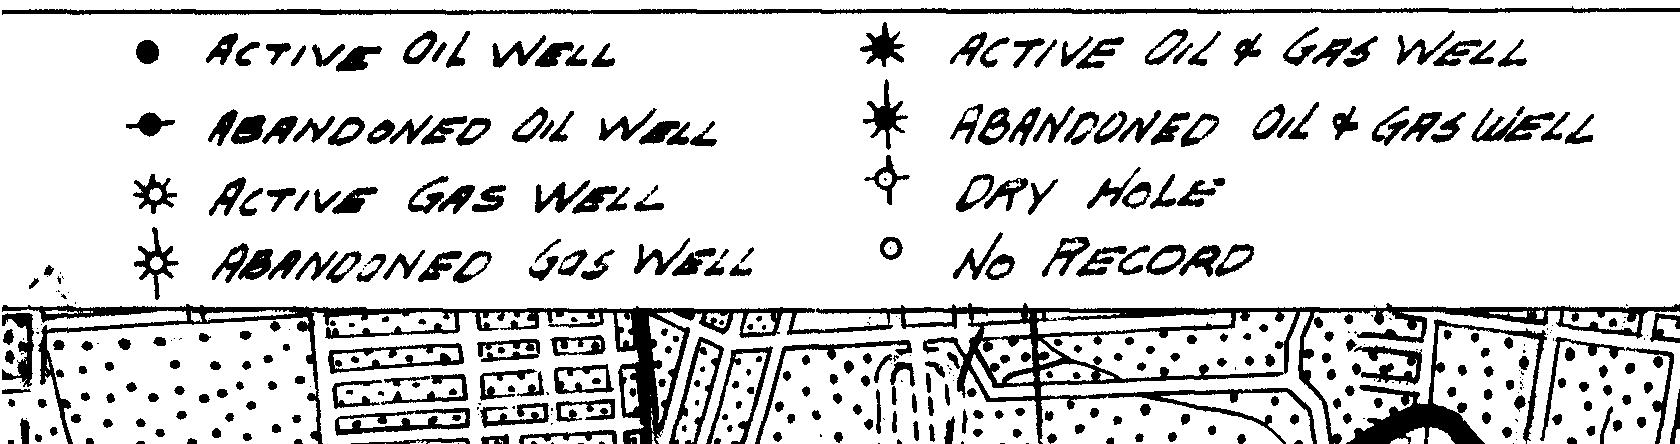
Figure 10. shows symbols for gas and oil wells shown on the WPA Map. (Note: An Active Oil or Gas well shown on the WPA-Map most likely is no longer active.)